Star Schema Explained: Facts & Dimensions
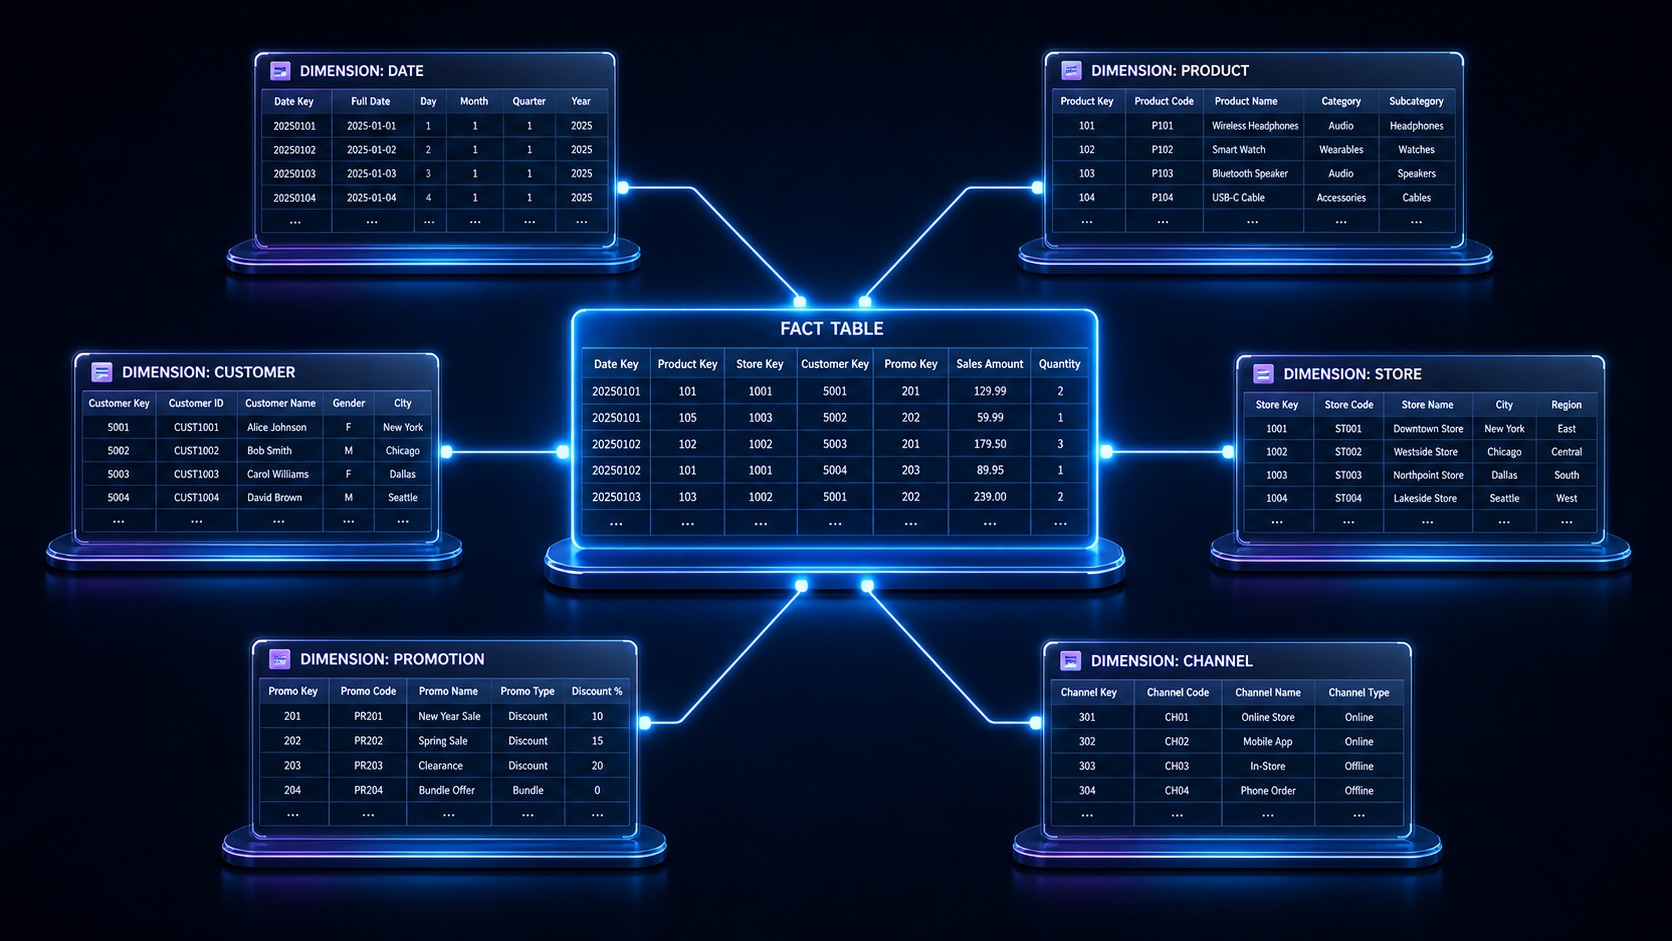
A star schema is the data-modeling pattern you’ll hit the moment you build your first real dashboard, and it’s far simpler than the name suggests. It organizes your tables into one central table of measurements surrounded by tables of context — shaped, when you draw it, like a star. This guide is for analysts and beginners who want facts, dimensions, and grain to finally make sense, with one worked sales example.
Why analytics needs a schema pattern
Databases that run apps are optimized to write one record at a time — place an order, update a profile. Analytics is the opposite: you summarize millions of rows at once, like ‘total revenue by month by country’. A star schema is the layout that makes those big summarizing queries easy to write and fast to run.
Instead of one giant table with everything jammed in, or dozens of tightly linked tables you must untangle, the star schema splits data into two clear kinds: things you measure, and things you slice by.
Fact tables: the measurements
The fact table sits at the center. Each row is an event or measurement — a single sale, a click, a shipment — and it holds two things: numbers you can add up (the ‘measures’) and keys that point out to the context tables.
A sales fact row might record quantity and amount, plus keys for which product, which customer, and which date. Fact tables are usually long and narrow: many millions of rows, but only a handful of columns.
- Measures — quantities, revenue, cost; the numbers you sum or average.
- Foreign keys — pointers to each dimension (product_id, customer_id, date_id).
- Degenerate fields — identifiers like an order number kept on the fact itself.
Dimension tables: the context
Dimension tables are the points of the star. Each one describes a thing you filter or group by — product, customer, store, date — with all its friendly attributes gathered in one place.
A product dimension holds the product’s name, category, and brand; a date dimension holds the day, month, quarter, and weekday for every date. Dimensions are usually wide and short: lots of descriptive columns, relatively few rows. When you write ‘revenue by category’, that ‘category’ lives in a dimension.
A worked sales example
Imagine an online store. Put one fact table in the middle and three dimensions around it:
- fact_sales — one row per order line: quantity, amount, plus product_id, customer_id, date_id.
- dim_product — product_id, name, category, brand.
- dim_customer — customer_id, name, country, signup date.
- dim_date — date_id, day, month, quarter, weekday.
Now ‘revenue by product category last quarter’ is a simple join: sum the amount from fact_sales, join to dim_product for the category, and join to dim_date to filter the quarter. That’s the payoff — business questions map almost word-for-word onto the tables.
Star vs snowflake
A snowflake schema is a star schema whose dimensions are split into further sub-tables. Instead of one dim_product that stores the category name directly, you’d have dim_product point to a separate dim_category table.
| Star | Snowflake | |
|---|---|---|
| Dimensions | Flat, denormalized | Split into sub-tables |
| Queries | Fewer joins, simpler | More joins, more complex |
| Storage | Slightly more (repeated text) | Slightly less |
| Best for | Most analytics, readability | Very large or tightly governed dimensions |
For most teams the star wins on simplicity: a few repeated words are a small price for queries anyone can read. Reach for snowflaking only when a dimension is genuinely huge or must be centrally managed.
Grain: the mistake beginners make
‘Grain’ means what a single row of your fact table represents, and defining it first is the most important modeling decision you’ll make. Is a row one order, or one line within an order? One day of a subscription, or one payment?
The classic beginner mistake is a fuzzy grain — mixing order-level and line-level rows in one table — which quietly double-counts revenue. Decide the grain in a single clear sentence before you build anything, and keep every row faithful to it.
How this powers fast dashboards
Star schemas are a big reason BI dashboards feel instant. The layout is predictable, so warehouses optimize for it, and joining a large fact table to a few small dimensions is a pattern query engines handle extremely well.
It’s also why self-serve analytics works: because dimensions hold the friendly labels, a non-technical user can drop ‘category’ and ‘month’ onto a chart and get the right answer. The star schema is the quiet groundwork under most reporting you’ll ever see — it lives in your warehouse and feeds every dashboard.
Frequently asked questions
What is the difference between a fact and a dimension?
A fact is something you measure — a sale, a click, an amount you can add up. A dimension is the context you measure it by — the product, customer, or date. Facts go in the central table; dimensions surround it and give it meaning.
Why not just use one big table?
You can, and for small or flat data a single wide table is fine. But as data grows, one giant table repeats context endlessly and gets hard to maintain; splitting facts from dimensions keeps things clean, consistent, and easier to query. Modern columnar warehouses also handle the star pattern very efficiently.
Is the star schema still relevant in 2026?
Yes. Even with cheap storage and powerful warehouses, the star schema remains the default for analytics modeling because it maps so cleanly onto how people ask business questions. The tools have changed; the pattern has held up remarkably well.
How is a star schema different from just writing SQL?
SQL is the language you query with; a star schema is how you arrange the tables you query. A good star schema makes your SQL shorter and clearer, because the joins are obvious and the grain is consistent. If you want to go deeper on the query side, see our SQL window functions guide.
A star schema is nothing exotic — it’s just facts in the middle, dimensions around the edge, and a clear grain holding it together. Get those three right and your reports will be easier to write and faster to run. For the big picture, start with our cornerstone guide, and once your model is in place, sharpen the queries that read it.
Last updated: July 6, 2026


Comments
Post a Comment